by Robert Santana, MS, RD, SSC, CSCS
The quest for strength acquisition involves careful consideration of human anthropometry and body composition. Anthropometry refers to the measurements and proportions of the human body. Body composition refers to the percentage of fat, lean mass, water, and bone in the human body. The most commonly used anthropometrics are height and weight. Waist, hip and various other circumference measures are additional metrics that provide some information regarding regional fat distribution. Body mass index (BMI) refers to the ratio of weight to height and is expressed as Weight (kg)/Height (m²). For our purposes, the variables of interest are lean mass, fat mass, body mass, and BMI, and their relationship to training performance.
Obesity, Bodyweight, and Assessment Tools
The quest for “optimal health” is one that humans have embarked on for centuries. At some point in the development of human civilization it was determined that excess bodyweight is associated with physical ailment. Over 2000 years ago, Hippocrates of Cos, the ancient Greek physician, described health for the human body as a balance of four “humors” (fluids): blood, black bile, yellow bile, and phlegm, and any deficiencies or extras were considered causes of diseases. Obesity was defined as the “surplus of humors.” Throughout much of humanity’s existence, excess bodyweight was considered an indication of good health, as well as wealth and prosperity. Hippocrates provided the first recorded “medical opinion” that obesity leads to infertility and early mortality. Approximately 2000 years later, his theories were investigated scientifically to evaluate how a “surplus of humors” relates to specific health outcomes and premature death.
To further understand the influence of bodyweight and/or bodyfat on health, various agencies developed weight “standards” and/or classifications. BMI, originally known as Quetelet’s Index, is the metric most commonly used by medical and academic institutions. This index was named after Adolphe Quetelet, a famous Belgian statistician, mathematician, sociologist, and astronomer, and is known as the founder of anthropometry. Quetelet was fascinated with bell curves to the extent that he actively sought them out across nature, notably in his study of anthropometry. He was not interested in obesity, rather, he was interested in quantifying the physical characteristics of a “normal man.” He quickly recognized that the weight/height relationship did not fit into a normal bell curve. To address this issue, he investigated the heights and weights of children and adults and compiled his findings into his three-part book titled A Treatise on Man and the Development of his Aptitudes. He arrived at the rather obvious conclusion that the height and weight relationship vary with age and often stabilizes into adulthood.
Quetelet’s work led to an attempt to develop anthropometric standards for insurance purposes. In 1912, the Medico-Actuarial investigation to assess the relationship between height and weight and mortality. This was followed up in 1959, and again in 1979, by Metropolitan Life Insurance Company (what we now know as MetLife), which resulted in publications of height and weight standards that came to be viewed as gospel by the medical industry and the general public.
There were some questionable methods that are worth addressing here. In the 1912 study clothing was not standardized, meaning that all the anthropometry data was collected in non-standardized conditions. Measurements – weight, height, girths – were taken with the participants dressed the way they showed up. And the document states that ~40% of the data may have been self-reported. The 1959 and 1979 Build studies addressed some of these concerns by requiring standardized clothing, collected measurements taken only in medical offices, and added “frame” size to the description. Unfortunately, “frame size” was measured by dividing the range of values into 3rds and referring to them as small, medium, or large; this designation was later dismissed.
With regards to ratio of actual to expected mortality, both BMI and weight for height relationships present with a U-shaped curve, which indicates that health risk is high at the extremely low and high ends (the “tails”) of the spectrum. The data from the Build studies reported such a relationship, but not without some questionable data points in the middle portion of that curve. For example, according to these tables a woman who is 5’3-5’6” (160 cm) should weigh between 115-164 lb (52-74.5 kg), which equates to a body mass index (BMI) of 18.6-29.1, which includes the high end of the overweight category and the low end of the normal weight category. Interestingly enough, the weight category associated with the lowest mortality for a 50-59-year-old woman at 5’3-5’6” was 185-194 lb (84-88 kg). This equates to a BMI of ~30-34, which includes the high end of Class I Obesity. The reasons for this inconsistency have never been elaborated on. The takeaway from this is that extreme bodyweights, both on the low and high ends, are likely to pose health risk. Everything in between should be taken on a case-by-case basis.
During the time that these height and weight tables were being derived, a professional researcher by the name of Ancel Keys was searching for a quantifiable metric to assess weight for height relationships. The index that correlated the poorest with height and greatest with fatness (as measured by skinfold calipers), would satisfy the criteria. Not surprisingly, Quetelet’s index met this criterion and in 1972 Dr. Keys referred to Quetelet’s index as BMI, the term still in use today. As most involved in strength and conditioning are aware, BMI is not the best indicator of fatness for a strength-trained individual.
Furthermore, healthcare professionals have acknowledged that it may not always be the best predictor of disease risk. Ancel Keys himself stated that this metric is not fully satisfactory for assessing health risk, is more suitable for population-wide assessment, and not suitable for individual assessment. In fact, his response to individuals asking him “when do I know if I’m too fat” his response was, “If you really want to know whether you are obese, just undress and look at yourself in the mirror. Don’t worry about our fancy laboratory measurements; you’ll know!” In summation, these criteria are decent, at best, for assessing large, untrained, populations of individuals but not for assessing individuals who train for strength.
After reading all of this, someone is bound to ask, “what about bodyfat percentage?” This discussion would be incomplete without assessing the individual components of human body composition. Body composition measurement refers to measurement of various “compartments” of the human body, most commonly fat, muscle, and more recently, bone mineral content. The most commonly used instruments to assess body composition, and thus measure bodyfat percentage, are skinfold calipers, bioelectrical impedance analysis (BIA), dual energy x-ray absorptiometry (DXA), hydrostatic weighing, and air displacement plethysmography (BODPod).
The Gold Standard
Prior to discussing the instruments and their advantages and disadvantages we must first clarify what we are measuring. The Gold Standard for body composition measurement is cadaver analysis. This means that you must die, donate your corpse to science, and permit us to excise all of your fat, muscle, organs, skin etc. and weigh out each of these to determine their contribution to your total body weight. The obvious limitation here is our ability to recruit volunteers. It’s also quite time consuming. Nonetheless, this was a popular area of research in the 1950s, in which Dr. Keys partook along with Josef Brozek. Cadaver studies led to the derivation of body density equations to be later used via the indirect methods of measurement that will be discussed below.
The “known” quantities of tissue density for fat, lean, and water are 0.9, 1.1, and 1.0 g/cm3 respectively. Keep in mind that “lean body mass” (LBM) does not mean “muscle. LBM refers to all bodyweight that is not fat. The assumptions derived from these studies suggest that fat density is constant, however, lean mass can vary with degrees of obesity, age, and clinical state. For instance, some fat is more vascular than others, meaning that some fat receives more oxygen and nutrients than other fat, depending on location. Some fat is denser, some fat is more watery, some fat contains more connective tissue. It’s difficult, if not impossible, to quantify this, regardless of what any “expert” may tell you. The important takeaway here is that based on a handful of cadaver studies, we are now saying that we “know” that fat density is 0.9 g/cm3, lean is 1.1 g/cm3, and water is 1.0 g/cm3. It’s safe to say that the density of water is likely the most accurate, although this can vary depending on mineral composition as well. Ultimately, we have more direct measures of water density available to us than we do human bodyfat or lean mass.
Skinfold Calipers
Perhaps the most widely used up until the 2000s, skinfold calipers provide a quick and easy method of estimating bodyfat percentage. Skinfold calipers are used to measure the double thickness of the skin at various sites. The most common measurement of skinfold thickness is the 3-site test, which consists of the abdomen, thigh, and pec for males and thigh, suprailiac, and triceps for females. Less commonly used are 7- and 9-site tests, primarily for practicality purposes. The sum of skinfolds is then used to calculate body density with a “validated equation” and then body density is then used to calculate bodyfat percentage. The obvious limitations here are the proficiency of the operator, since skinfold measurement is a hand skill, as well as the assumption of the normal distribution of sub-Q fat, and that you cannot obtain sufficiently accurate skinfold measurements from obese individuals and individuals with thicker or tight skin. There are other sources of variability (clinical status, age, etc.), but you get the picture. Unless you are a “healthy” human with a reasonably elastic skin, well hydrated, and non-obese, this method isn’t going to tell us a whole lot about your body fat mass. It can, however, tell us whether fat mass is changing over time in a given area provided reliable methods are employed consistently.
Densitometry
In an effort to be concise, I will consolidate Air Displacement Plethysmography (BODPod) with hydrodensitometry (Underwater Weighing). Both of these methods measure body density, which is then used to determine bodyfat percentage. Hydrodensitometry is the original method of directly measuring body density. This method is based on Archimedes principle that states that “the buoyant force which water exerts on an immersed object is equal to the weight of water that the object displaces.” So a large fluffy object displaces more water than a lead ball, and is therefore more buoyant because it is less dense.
The hydrodensitometry method follows these concepts and consists of submerging a subject underwater while seated on a scale, instructing the subject to exhale as much air as possible, and then measuring the underwater body weight. Residual lung volume is the amount of air remaining in the lungs after a forceful exhalation. This also needs to be measured to account for its contribution to buoyancy. Basically, we are measuring the difference between the buoyed and unbuoyed weight of the body, and thus its density, and the composition of its relative compartments is then inferred from equations developed from cadaver data. The BODPod follows the same concept except rather than sitting underwater, the human sits in an egg-shaped chamber, where the amount of air displaced (versus water) is used to determine body density. This is then used to calculate percent bodyfat.
Now, let’s put this into context. What happens if you water-cut 20 lb for a meet? Won’t this affect your measurement? Water loss would not affect the density measurements of fat and lean mass since the density of water is 1.0g/cc, meaning that changes in the mass of water are equal to changes in the volume of water (Density = mass/volume). However, the mass of the fat and lean compartments would obviously change since total mass changes. In this case, density would drop because dense water was lost and fluffy fat was spared, and to the densitometer it would appear that you are fatter than you are. But this assumes that water is selectively lost from lean body mass and not fat, and we don’t know that this is true.
In summary, densitometry is pretty good at measuring body density but not so good at measuring the mass of each compartment. Lastly, keep in mind that our knowledge of these known quantities is highly limited due to minimal human data so these measurements can paint a different picture for various individuals.
DXA
Perhaps Dual X-Ray absorptiometry is the most popular method today and is considered the “gold standard” among indirect body composition measurement instruments. DXA was originally intended for measuring bone density. Two x-ray beams pass through the subject’s body and are collected by a x-ray detector. Bone and soft tissue have known attenuation coefficients, which refers to the amount of the x-ray beam lost when it passes through the mass of an object. In other words, when the two x-rays pass through your body, the amount remaining when they hit the x-ray detector tell us the density of the structures – the soft tissue and bone – they passed through. Again, like all indirect methods, these are predictions/estimations and not actual measurements of the compartments.
DXA is subject to variability with repeat measurements, which means that it is not a very good tool to track trends, especially larger trends such as those associated with larger weight losses. The accuracy in extremely obese individuals is also questionable due to the difficulty distinguishing the different compartments in the presence of high body fat. The device also estimates halves of the body when individuals are too large to stay within the scanning bed. Lastly, the device is also promoted as being able to measure the visceral fat around the central organs. This is in fact an estimation, based on the difference between total fat mass and subcutaneous fat mass, with subcutaneous fat mass derived from the details of the scan itself.
The influence of fluid fluctuations cannot be overstated either. Let’s say you are cutting for a meet and hop in the DXA. The measurement will underestimate your lean mass (since water is not fat) and thus overestimate your fat percentage. The same can be said if you are deep into a cut and partially, or fully, glycogen depleted. Any loss or gain of non-fat bodyweight can swing this measurement up or down. In short, DXA is pretty decent at measuring bone density but not very good at measuring lean mass.
Waist & Hip Circumferences
Lastly, a brief discussion of circumference measurements is necessary since many diet coaches require them as part of the assessment process. Circumference measurements do not measure body composition per se but do provide information about regional fat distribution. Correlations between waist circumference and waist-to-hip ratio have consistently indicated that as these metrics increase, cardiometabolic disease risk increases. High quantities of abdominal fat are correlated with cardiometabolic disease risk, which has led to the recommendation that males should keep their waist circumference <40 in (102 cm) and females should keep their waist circumference <35 in (88 cm), with a normal waist-to-hip ratio of 0.9 for males and 0.85 for females. Similar to the previously described measurements, these are not always accurate for individual assessment.
As we train, our abdominals, obliques, spinal erectors, and lats all increase in size, which can contribute to a larger waist circumference. Variability in bone structure must also be taken into account, since individuals who are taller or have larger pelvic dimensions may be very lean with a larger waist circumference than individuals who are shorter with smaller pelvic dimensions and smaller waist circumferences at the same level of leanness. A practical way to use this metric is to track it over time and monitor changes. The regional musculature will grow but not to a very large extent, so large changes in waist circumference are typically reflective of fat gain.
So How Lean Should I Be?
The million-dollar question that many want the answer to. From a health risk standpoint, between the actuarial data and epidemiological studies that followed up, it appears that the relationship between BMI and health risk presents a U-shaped curve. This means that if you are extremely underweight or extremely obese you likely need to gain or lose weight, respectively. Any risk with the overweight category (BMI 25-29.9) essentially disappears if you are physically active with a similar trend in the class I obese category (BMI 30-34.9). So the folks in the middle are probably just fine.
Bodyweight and Training
So now that all of that dry history on anthropometry and measurement is out of the way, let’s discuss BMI, body composition and strength acquisition. It is clear that there is a linear relationship with body weight and 1RM as evidenced by powerlifting, Olympic Weightlifting, and Strengthlifting records. In general, the heaviest weights are lifted by competitors in the heaviest weight classes. There are multiple reasons for this. The most obvious is that heavier individuals generally have more muscle mass. More muscle mass, and thus more contractile tissue, generally produces more force. Therefore, the guy with the most muscle mass will generally lift the most weight. Yes, there are outliers, we aren’t here to discuss them. We are talking about you; the person in the middle of the bell curve, with the most reproducible results.
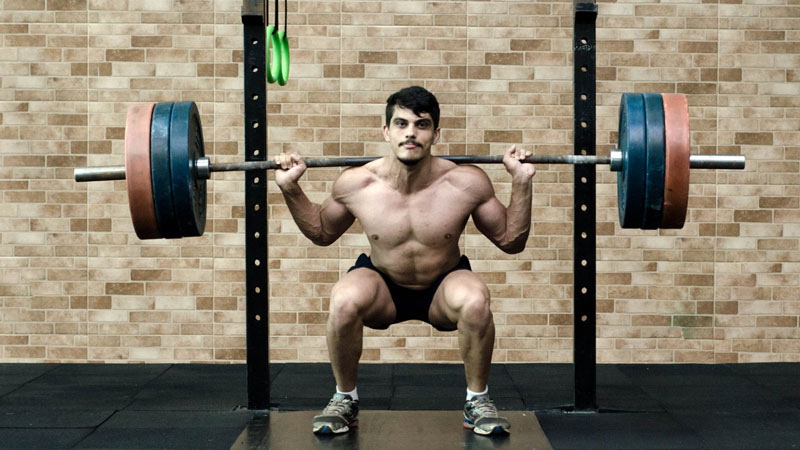
The second part of this is bodyfat. Yes, bodyfat contributes to 1RM. Let’s begin by discussing how this contributes to a Squat. A quick YouTube search on heavy squats will show super heavyweight squatters, with large waist circumferences and invisible abs, performing 800-1000 lb squats. A sufficient explanation as to why this happens is absent in both academic literature and commercial training literature. I will attempt to explain.
Overweight/obese individuals have higher intra-abdominal pressure at rest. Higher intra-abdominal pressure allows for greater force transmission along the trunk segment. Therefore, having a larger abdominal circumference may increase force transmission in all the lifts via an increase in intra-abdominal pressure. And the body’s Center of Mass changes with increases in waist circumference. A bigger gut would elevate and move anterior the COM relative to its normal position with a smaller waist. This results in a more naturally horizontal back angle when balanced in the bottom of a squat than the same guy with visible abs, and thus resulting in more muscle mass used (as described in The Blue Book).
Lastly, and most important, subcutaneous fat around the waist, the hips, and the knees adds pressure, support, and rebound out of the bottom of the squat, and a great deal of stability to the start position of the press. It significantly improves the rebound mechanics of the bottom of these two movements by creating a manageable impingement around the extending joints, and increasing bar speed at a critical time in the movement pattern by increasing the force of the stretch reflex.
The deadlift behaves a bit differently, although world record deadlifts (e.g. Eddie Hall) have been produced with large waist circumferences. Since you are not Eddie Hall, the downside to having an excessively large waist must be considered. The back angle on a deadlift is often fairly horizontal. Obviously, longer arms and shorter legs may produce a more vertical back angle, but even with longer arms the abdomen is generally facing more or less down. First, the large abdomen can impinge on the thighs, which will require the lifter to widen his stance, and thus his grip, which extends the ROM of the pull.
A large gut can also weigh as much as ~100 lb. In fact, I personally know someone who weighed his abdomen on a tabletop scale in a machine shop, and it weighed 95 lb. This means that the spinal erectors are not only resisting the load on the bar but also the load of the large abdomen. These reasons could partially explain why many big squatters often have deadlifts 200-300 lb less than their squat. Again, this is purely speculative, but what we do know from practical experience is that when superheavyweight lifters undergo significant weight loss, their squat, bench press, and press 1RMs tend to decrease, while the deadlift remains stable or in some cases increases. This is believed to be related to improvements in pulling mechanics produced by decreased thigh and hip girth with weight loss, and the explanation above presents one potential reason for why big is better for squats than for deadlifts.
Summary
So, what do we do with all of this? First, as stated in my article on caloric recommendations, in an anabolic environment both fat and muscle are deposited at the same time and the two are inextricably related. To expand on this discussion, it is important to understand that both fat and muscle contribute to PRs via different mechanisms. Some bodyfat is advantageous for lifting heavier weights, it helps more with some lifts than others, and too much creates a situation where you are unable to perform any of the lifts because of an inability to move through the full range of motion.
From a health standpoint, there is a U-shaped curve, which tells us that the extremes are probably Not Good. Therefore, we want you somewhere in the middle where you can bring up your total (squat, press/bench press, and deadlift), live healthy, and “look good” by your own standards. Visible abs are not what we do, so the discussion of the implications of this for physique-focused sports is beyond the scope of this article. A safe range of bodyfat for the strength and health-focused individual would be in the range of 15-25% for males and 20-30% for females. The waist circumference recommendations of 40” for males and 35” for females is a pretty safe recommendation for most lifters, so we’ll stick with that. Since we are often discussing weight for height, BMI recommendations can also prove useful. A BMI of 25-30 for males and 20-25 for females is probably a safe range to reference for novice lifters, with this number gradually increasing with training. Some of you will sit comfortably on the lower end of this range and some of you will sit comfortably at the higher end of this range. This is something you will learn through trial and error.
Lastly, unless you have an untrained BMI >30, you should not be attempting weight loss on The Program, regardless of bodyfat percentage. Yes, if you are the guy with the BMI of 22 and bodyfat percentage of 27%, then you need to reduce the percent bodyfat via an increase in lean mass. You are not “skinny fat” – you are “undermuscled.” This is a very important distinction. Cutting to an underweight BMI to produce visible abs is not advantageous for either training purposes or health.
In summary, getting very lean (unless you are naturally very lean at baseline) will likely cause similar health problems as getting very fat. You’ll have to train, eat, and repeat this process over time to figure out where you comfortably sit. Hiring a competent nutrition coach can go a long way here. Otherwise, you can simply refer to this series of articles for a general roadmap to your success under the bar.
A version of this article appeared in Starting Strength on 12/18/2018

